

The point.
- We marked seventeen published European market forecasts against where the index closed on the day each one was aiming at. The middle one was out by 6.0%.
- That is bigger than an ordinary year. The STOXX Europe 600 moved 5.4% across the whole of 2024, measured the same way.
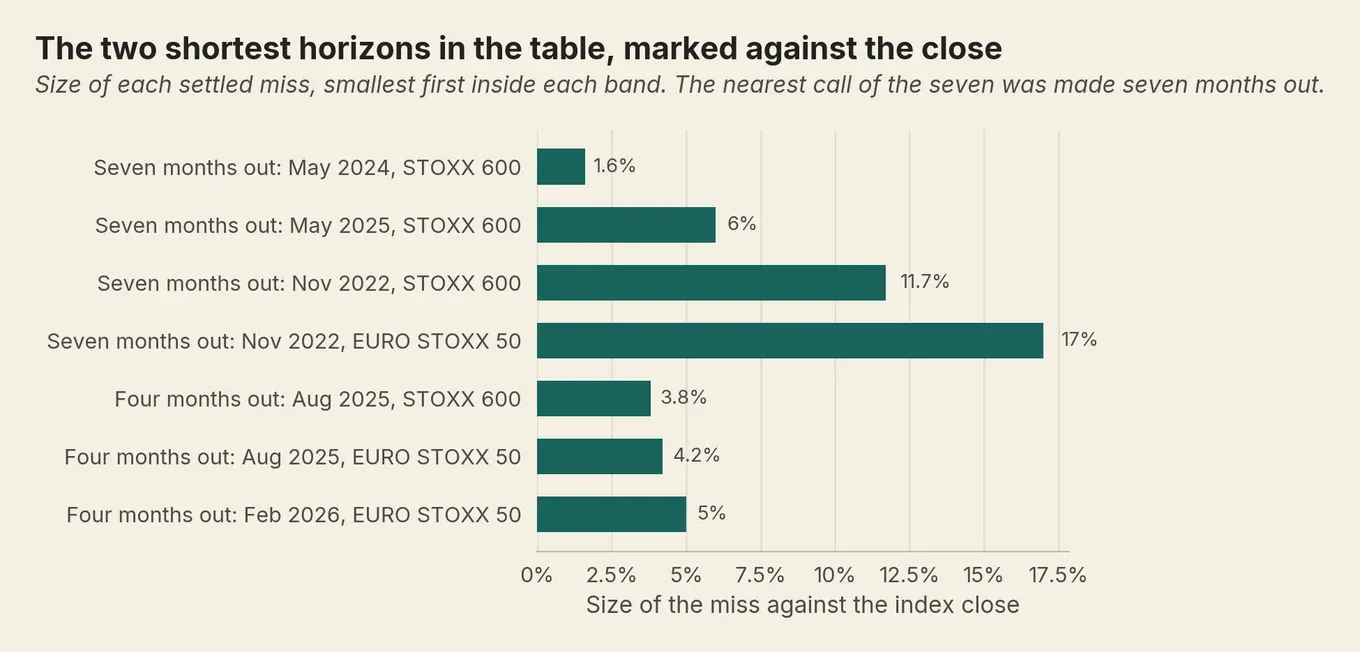
- Forecasting from closer to the finish line did not help. The three four-month calls were out by 3.8%, 4.2% and 5.0%; the four seven-month calls ran from 1.6% to 17.0%.
- Every year in this batch was a rising one, so "too low" says something about those years rather than about forecasters.
- Timing is two decisions, not one, and both cost money. One 2023 round trip would have cost about €550 on €10,000, before any tax.
- Some managers genuinely have timing skill and roughly as many are reliably bad at it. Nothing we could find lets you check which sort you are holding.
- All of this is a past record. Past performance is not a reliable indicator of future results, and the value of investments can fall as well as rise.
The point.
- We marked seventeen published European market forecasts against where the index closed on the day each one was aiming at. The middle one was out by 6.0%.
- That is bigger than an ordinary year. The STOXX Europe 600 moved 5.4% across the whole of 2024, measured the same way.
- Forecasting from closer to the finish line did not help. The three four-month calls were out by 3.8%, 4.2% and 5.0%; the four seven-month calls ran from 1.6% to 17.0%.
- Every year in this batch was a rising one, so "too low" says something about those years rather than about forecasters.
- Timing is two decisions, not one, and both cost money. One 2023 round trip would have cost about €550 on €10,000, before any tax.
- Some managers genuinely have timing skill and roughly as many are reliably bad at it. Nothing we could find lets you check which sort you are holding.
- All of this is a past record. Past performance is not a reliable indicator of future results, and the value of investments can fall as well as rise.
A few times a year, Reuters asks Europe’s equity strategists where the market will finish. On 27 May this year, they said 645 (opens in new tab).
The market in question is the STOXX Europe 600, a broad basket of 600 European companies. It closed at 628.18 the day the poll came out, so 645 meant a climb of about 2.7% between then and December.
It got there on 2 July. Five weeks.
There was nothing to correct, of course. A forecast isn’t a promise.
That’s rather the arrangement. Every year, several of the best-paid people in European finance publish a specific number for where the market lands. Newspapers print it. It gets quoted at people deciding what to do with their savings. Then December arrives and, as far as we can find, nobody goes back to check.
The exam is set in public every year. As far as we can find, nobody marks it.
So we marked a run of it. Twenty-four published calls, each with a date, a publisher and a number attached. Seventeen have reached their finish line.
The middle miss was 6.0%. To put that somewhere useful: the STOXX Europe 600 rose 5.4% across the whole of 2024, measured the same way. The typical miss is bigger than the typical year.
Does market timing work, then? A definition first, because the phrase gets used loosely. Market timing means holding more or less of the market than your plan says, because of what you think is about to happen next. Your colleague who has “gone to cash for a bit” is timing.
Two neighbouring questions live elsewhere. Whether to put a lump sum in now or feed it in slowly is one. Whether to sit tight while the market falls is the other.
How badly did they miss?
Nine of the seventeen were out by 6% or more. The worst was out by 17%. The best was out by 0.8%.
One condition before you enjoy that too much. Every year in this run was a rising one for European shares, and a forecast that undershoots a rising market looks too low every single time. So the fact that fifteen of the seventeen came in low tells you about 2023 to 2026, not about the people making the calls.
Run the same exercise over 2008 or 2022 and the same houses would have been embarrassed in the other direction. What the numbers do tell you is the size of the misses. Size is the bit you’d have had to bet on.
Does forecasting closer to the deadline help?
Not in this sample: the three calls made four months out missed by 3.8%, 4.2% and 5.0%, while the four made seven months out ranged from 1.6% to 17.0%, and the nearest of those seven came from the longer group.
You’d think a shorter run at it would be a safer bet. Same distance to the finish line, wildly different results, and halving the horizon narrowed the spread without producing a single accurate call.
What does a forecast do while you’re waiting for it?
It moves. In May 2025 the consensus for where the Europe 600 would end 2026 was 570 (opens in new tab). By November it was 623 (opens in new tab). By February, 640 (opens in new tab). By May, the 645 at the top of this piece.
One question, four answers, each one issued a little closer to a market that kept setting records.
And the number you get shown is a median, which quietly buries how much the people behind it disagreed. One May 2024 poll (opens in new tab) had a median of 513. The individual answers ran from 435 to 600. Nobody can honestly write “strategists expect 513” about that.
Seven of the twenty-four calls are still live, all of them on where 2026 ends, including that 645. Where the index finishes in December, we don’t know. On this record, neither do they.
Why is timing harder than it looks?
Because it’s two decisions, not one. You get out, and then you get back in, and both have to land. Getting the crash right and the recovery wrong isn’t half a win. It’s a loss with a good story attached.
Your colleague who has gone to cash may well be right about the falling bit. They still have to be right twice.
How often would you have to be right?
One published attempt (opens in new tab) to work out the bar lands on getting at least seven years in ten right, which is a good deal more often than most people assume when they decide to sit a year out.
Not five. Seven. If you could call seven Decembers out of ten, you would not be reading this on a Sunday night.
What does one round trip cost?
Numbers help here, so here’s one, taken from the first row of the table below.
In November 2022, the poll said the Europe 600 would be at 408 by the end of June. The index was sitting at 437.85 the day it came out, so the call was for a fall of roughly 7%. Say you read it, believed it, and sold €10,000 of a fund tracking the index.
On 30 June 2023 the index closed at 461.93, and you bought back in. Out at 437.85, back at 461.93. The round trip cost you about 5.5%, or roughly €550 of your €10,000.
That figure is share prices only, so it leaves out seven months of dividends you’d have collected by sitting still. Those land on one side of the comparison and not the other, which means €550 flatters the trade rather than the reverse.
It’s also before any dealing charge, before tax, and before whatever the cash earned while it sat out. This is one call on one date, put here to size a cost rather than to predict anything, and it isn’t a suggestion to sell or to hold. Past performance is not a reliable indicator of future results, and the value of investments can fall as well as rise.
Then the tax, which people forget because it never shows up on a chart. Sell a fund at a profit in Ireland and the tax is 38% of the gain, whether the fund is Irish (opens in new tab) or a similar one based elsewhere in the EU (opens in new tab). That’s the rate from 1 January 2026, and the small capital-gains allowance people know about doesn’t reach it. On a €3,000 gain, that’s €1,140. Buying back in doesn’t give it back.
And in Ireland you meet that tax every eight years anyway, whether you sell or not.
That’s one country, picked to make the number real. Your own rate depends on where you live and what you’re holding it in, and some wrappers change the answer completely.
Was that rebalancing, or was it timing?
The two feel identical while you’re doing them, which is why rebalancing gets used as cover for the other thing. Four questions sort it out.
- Am I moving away from the weights I picked, or back towards them?
- Did a price or a headline set this off, or a date I chose months ago?
- Do I have a written rule for getting back in, or a plan to feel my way?
- Have I worked out the tax?
Away, headline, no rule, no tax. That’s timing. No shame in it, but call it what it is.
So can anybody do this?
Yes, some people can, and saying otherwise would be a tidy little lie. One study of share funds across 17 European countries (opens in new tab) found about one fund in ten with real timing skill, more than luck could explain. It found roughly the same proportion who were reliably bad at it. Both halves belong in the same sentence, because a pool holding real skill and real anti-skill looks, from the outside, an awful lot like noise.
The catch is checking. Nothing we could find lets you look up whether a fund’s timing worked.
We read the two big European fund scorecards, SPIVA Europe (opens in new tab) and ESMA’s annual report (opens in new tab). Both are worth your time. Neither separates what a manager got from moving the money around from everything else they did, so neither settles this question in either direction. Whether active funds beat trackers overall is a separate argument, and a much better documented one.
Our working, if you want to check us
Every settled call, marked against where the index closed on the day it was aiming at. One rule: a published number, a date, a named publisher, and the date has passed. Everything that cleared it is in here.
| Forecast made | The call | Where the index closed | Out by |
|---|---|---|---|
| November 2022 | STOXX Europe 600 at 408 by end of June 2023 | 461.93 | 11.7% too low |
| November 2022 | STOXX Europe 600 at 434 by end of 2023 | 479.02 | 9.4% too low |
| November 2022 | EURO STOXX 50 at 3,650 by end of June 2023 | 4,399.09 | 17.0% too low |
| February 2024 | STOXX Europe 600 at 510 by end of 2024 | 504.85 | 1.0% too high |
| February 2024 | EURO STOXX 50 at 4,800 by end of 2024 | 4,869.28 | 1.4% too low |
| May 2024 | STOXX Europe 600 at 513 by end of 2024 | 504.85 | 1.6% too high |
| May 2024 | STOXX Europe 600 at 537 by end of June 2025 | 541.37 | 0.8% too low |
| May 2024 | STOXX Europe 600 at 556 by end of 2025 | 592.78 | 6.2% too low |
| May 2024 | EURO STOXX 50 at 5,400 by end of 2025 | 5,796.22 | 6.8% too low |
| February 2025 | EURO STOXX 50 at 5,325 by end of 2025 | 5,796.22 | 8.1% too low |
| February 2025 | STOXX Europe 600 at 610 by end of June 2026 | 641.73 | 4.9% too low |
| February 2025 | EURO STOXX 50 at 5,725 by end of June 2026 | 6,328.09 | 9.5% too low |
| May 2025 | STOXX Europe 600 at 557 by end of 2025 | 592.78 | 6.0% too low |
| May 2025 | STOXX Europe 600 at 570 by end of June 2026 | 641.73 | 11.2% too low |
| August 2025 | STOXX Europe 600 at 570 by end of 2025 | 592.78 | 3.8% too low |
| August 2025 | EURO STOXX 50 at 5,550 by end of 2025 | 5,796.22 | 4.2% too low |
| February 2026 | EURO STOXX 50 at 6,011 by end of June 2026 | 6,328.09 | 5.0% too low |
Fifteen of the seventeen came in too low, and in a run of rising years that says more about the years than about the forecasters.
The calls are the median answers from Reuters polls of European fund managers and equity strategists, published on 28 November 2022 (opens in new tab), 22 February 2024 (opens in new tab), 22 May 2024 (opens in new tab), 26 February 2025 (opens in new tab), 29 May 2025 (opens in new tab), 20 August 2025 (opens in new tab) and 24 February 2026 (opens in new tab). The closes are the index level on the day each call was aiming at, from daily history for the STOXX Europe 600 (opens in new tab) and the EURO STOXX 50 (opens in new tab). Every level here is share prices in euros with dividends left out, which is the basis the forecasts themselves use. Seven further calls are still open, all on where 2026 ends; they are discussed above rather than marked here. Past performance is not a reliable indicator of future results.
Two honest limits, while you have the table in front of you. It covers what got reported, so a call that was quietly right, or quietly dropped, never reaches a list like this.
And seventeen rows are not seventeen separate verdicts. They come from seven poll dates on two indices that move together, and several rows are marked against a close another row has already used. That doesn’t shrink any individual miss, which is the thing the table is here to show. It does mean you shouldn’t read the row count as seventeen independent tests.
Mark the one that’s yours
Marking a run of Europe’s forecasts took an afternoon. They missed, which was always likely, and that isn’t the annoying part. The annoying part is that checking is this cheap and we still couldn’t find anybody doing it.
You can run the same exercise on the only paper that concerns you. If you hold something sold on timing skill, two numbers on its factsheet tell you where you stand: the ongoing charge, and how the fund has done against the benchmark it chose for itself. It chose that benchmark, which is what makes it the fair test rather than one picked to flatter or to damn it. Both take about four minutes to find.
They won’t tell you whether the timing worked. Nothing we found will. They’ll tell you what you’re paying, and what you got. The value of investments can fall as well as rise, and ten years of record settles nothing about the next ten. But you’d be marking the right exam.
Frequently asked questions
Does market timing work?
What is market timing?
Can you really time the European stock market?
Are stock market forecasts helpful or harmful?
Tactical asset allocation vs static indexing: who wins?
Sources (17)
- Reuters poll of European equity strategists, 28 November 2022 (Investing.com syndication)
- Reuters poll of European equity strategists, 22 February 2024 (Investing.com syndication)
- Reuters poll of European equity strategists, 22 May 2024 (Investing.com syndication)
- Reuters poll of European equity strategists, 26 February 2025 (Investing.com syndication)
- Reuters poll of European equity strategists, 29 May 2025 (Investing.com syndication)
- Reuters poll of European equity strategists, 20 August 2025 (Investing.com syndication)
- Reuters poll of European equity strategists, 26 November 2025 (Investing.com syndication)
- Reuters poll of European equity strategists, 24 February 2026 (Investing.com syndication)
- Reuters poll of European equity strategists, 27 May 2026 (Investing.com syndication)
- Yahoo Finance chart API: STOXX Europe 600 daily index history
- Yahoo Finance chart API: EURO STOXX 50 daily index history
- Buzzacchi and Ghezzi: The Odds of Profitable Market Timing (JRFM 14:250)
- El Ammari, Vidal and Vidal-García: European market timing (Journal of Economic Asymmetries 27:e00279)
- S&P Dow Jones Indices: SPIVA Europe Mid-Year 2025 Scorecard, data to 30 June 2025
- ESMA: Market Report, Costs and Performance of EU Retail Investment Products 2025
- Revenue (Ireland): Tax and Duty Manual Part 27-01A-02, Investment Undertakings, exit tax rate table
- Revenue (Ireland): Tax and Duty Manual Part 27-04-01, Offshore Funds, disposal of a material interest
— That's the lot. It is now night.
Want more of this in your Google results?
Add Money Owl as a preferred source, and Google will show our finance pieces higher when you search for them.
By Jure Jaklič
Founder and editor of Money Owl. Data analyst by trade; personal finance learned first-hand across six European countries.
Recommended

Dividend investing in Europe: is it really passive income?
Pooled across 2018, 2019, 2021 and 2022, 70.6% of European once-a-year dividend payments arrived in April, May and June. What that does to a monthly budget, and what living off it really costs.

Should I wait to invest? Five reasons people give
We ran 107,454 windows of European tracker-fund history since 2008. Waiting won three times in ten. Five reasons Europeans give for holding off, cross-examined: three lose, two hold up.

What ESG investing means, and what it changes about what you own
Two funds, same ESG label. One index targets a quarter of each sector's tradable market value, the other half. That figure is not on your factsheet.