

The point.
- Your shares pay for the dividend. On the ex-dividend day the price is marked down by close to the whole payment: one study of German-listed shares paying tax-free dividends put the fall at about 87% of the dividend over 2002 to 2019.
- Passive it is: you decide nothing. Regular it is not. Across 17 European markets in 2018 to 2022, 52.2% of listed dividend payments came once a year; in Germany 97.4%, in the UK 10.2%. Those are shares of payments, not of companies.
- Among European once-a-year payers, 70.6% of payments arrived in April, May and June and 5.7% across November to February, pooled across 2018, 2019, 2021 and 2022. Monthly income from that is a budgeting job, not a portfolio one.
- A broad European index (MSCI Europe, not the eurozone) yielded 2.80% gross at 31 July 2026, so an illustrative €30,000 a year needs roughly €1.07m invested. Investment values can fall as well as rise, and what a portfolio pays out depends on what its companies vote to distribute and on the charges taken along the way.
- The eurozone European Dividend Aristocrat index asks for at least 10 consecutive years of increasing or stable dividends, so a company that hasn't raised its payment in a decade still qualifies.
- Dividends are voted each year, not owed. Of the companies in that study paying dividends on a regular schedule before 2020, 35.2% paid nothing in 2020 and 24.3% were still paying less in 2022 than in 2019.
The point.
- Your shares pay for the dividend. On the ex-dividend day the price is marked down by close to the whole payment: one study of German-listed shares paying tax-free dividends put the fall at about 87% of the dividend over 2002 to 2019.
- Passive it is: you decide nothing. Regular it is not. Across 17 European markets in 2018 to 2022, 52.2% of listed dividend payments came once a year; in Germany 97.4%, in the UK 10.2%. Those are shares of payments, not of companies.
- Among European once-a-year payers, 70.6% of payments arrived in April, May and June and 5.7% across November to February, pooled across 2018, 2019, 2021 and 2022. Monthly income from that is a budgeting job, not a portfolio one.
- A broad European index (MSCI Europe, not the eurozone) yielded 2.80% gross at 31 July 2026, so an illustrative €30,000 a year needs roughly €1.07m invested. Investment values can fall as well as rise, and what a portfolio pays out depends on what its companies vote to distribute and on the charges taken along the way.
- The eurozone European Dividend Aristocrat index asks for at least 10 consecutive years of increasing or stable dividends, so a company that hasn't raised its payment in a decade still qualifies.
- Dividends are voted each year, not owed. Of the companies in that study paying dividends on a regular schedule before 2020, 35.2% paid nothing in 2020 and 24.3% were still paying less in 2022 than in 2019.
Between November and February, European companies that pay one dividend a year make 5.7% of their payments. Four months. About one in eighteen, in a stretch of the calendar that contains Christmas and the January bills.
Most people come to dividend investing in Europe wanting one thing: money that turns up without them having to decide when to sell. That’s a sane thing to want. Deciding when to sell is the worst job in personal finance, and a dividend takes it off you. On that count the promise holds.
One number for scale. A broad European equity index yielded 2.80% gross at the end of July 2026 (opens in new tab). Gross means before tax and before charges. The ECB’s deposit facility rate (opens in new tab) is 2.25% as of late August 2026. Euro-area inflation (opens in new tab) ran at 2.9% in July 2026.
So the income half of a broad European holding sits at roughly the ECB’s rate, and slightly under inflation. Only the income half. A shareholder also owns whatever the shares themselves do next, up or down, and that isn’t in those three numbers.
Is dividend investing really passive income?
Dividend investing is passive, yes: you decide nothing. Income, in the sense of extra money from outside, no. On the day a share goes ex-dividend, its price gets marked down by close to the whole payment. Regular fails hardest: a European share paying once a year is normal.
The regular part has a fix, and it’s a second bank account, not a better shortlist of shares.
On the ex-dividend day the share starts trading without the right to the payment that’s coming. Borsa Italiana’s own glossary says what happens to the price at that moment. The share detrae quel valore dalla propria valutazione di Borsa (opens in new tab): it deducts that value from its own exchange price. That’s the exchange, on the record, about its own market.
The index rulebooks are built on the same fact. STOXX writes it into the guide that governs how dividends hit its equity indices (opens in new tab).
All corporate actions and dividends are implemented at the effective date (ex-date); i.e. with corporate actions where cash or other corporate assets are distributed to shareholders, the price of the stock will drop on the ex-date.
How close does the deduction get to the full dividend? Close. A study of German-listed shares paying tax-free dividends (opens in new tab) put the fall at about 87% of the dividend over 2002 to 2019, and about 92% in the years from 2009. Both are estimates, and neither sits far enough below the whole dividend to be told apart from it. The paper’s own summary is blunter: “ex-date prices decline, on average, by the amount of the dividend.”
The dividend, then, is not a bonus paid on top of the shares. It’s a withdrawal from them that somebody else scheduled. That’s still not nothing. A withdrawal you didn’t have to decide on is the thing you came for in the first place.
How often do European companies pay dividends?
Just over half of listed dividend payments come once a year, and the gap between markets is the whole story. In Germany, 97.4% of them are the once-a-year kind. In the UK it’s 10.2%. Those are shares of payments, not of companies.
| Market | Share of listed dividend payments that come once a year |
|---|---|
| Germany (DE) | 97.4% |
| Italy (IT) | 83.2% |
| France (FR) | 81.9% |
| Portugal (PT) | 60.9% |
| Netherlands (NL) | 35.7% |
| Spain (ES) | 29.2% |
| Ireland (IE) | 15.5% |
| United Kingdom (GB) | 10.2% |
| All 17 markets in the study | 52.2% |
Those figures come from a study of 3,029 dividend-paying companies across 17 European markets (opens in new tab), covering 14,844 payments between 2018 and 2022. The euro-area markets in it land right across that range.
Portugal’s row rests on only 20 companies, so treat it as a hint rather than a finding. If you hold shares listed somewhere this table doesn’t cover, the company’s investor-relations page carries its own dividend calendar.
Why do most German companies pay once a year?
The law, not shyness. Paying twice is more trouble than it’s worth: an interim dividend is only possible if the company’s articles allow one, and even then German company law (opens in new tab) caps the amount and the supervisory board has to sign it off.
Under the standard articles a UK public company runs on (opens in new tab), directors can decide an interim dividend between themselves, no shareholder vote required. That’s the calendar the quarterly-dividend guides are built on. If that’s where you learned this, you learned a different rulebook.
In Germany the rest of the calendar hangs off the shareholder vote. The payment falls due on the third business day after that vote (opens in new tab), unless the vote itself or the articles set a later date. Either way, the vote is not yours.
When in the year do European dividends arrive?
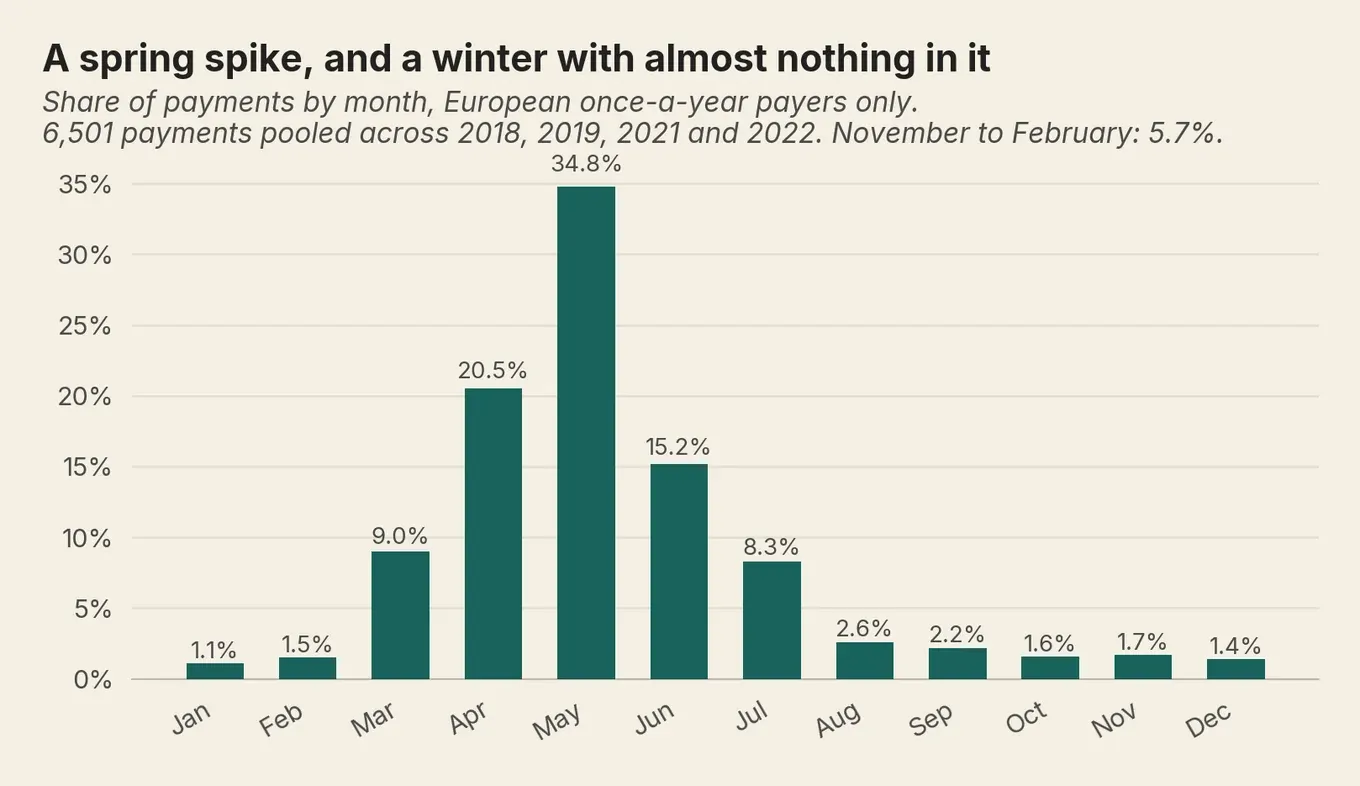
Mostly in the spring: 70.6% of annual payers’ dividend payments arrived in April, May and June. That pools 2018, 2019, 2021 and 2022, leaving 2020 out for reasons that will be obvious. May by itself took 34.8%.
Stretch the window back to March and you have 79.6% of the year inside four months. Then the long flat bit: 5.7% across November, December, January and February.
It isn’t one freak year either: the April-to-June share never dropped below 66.9% in any of the four years.
That shape is easy to read on a chart and harder to live on.
Elena, 44, runs a translation business outside Bologna. She holds a handful of German- and Italian-listed shares, every one of them a once-a-year payer. Between them they paid her €12,000 gross last year, which she had been reading as €1,000 a month.
It was not €1,000 a month. All of it cleared between April and June, and the next payment is the following April. So €9,000 of that €12,000 was never spring money. It’s July-to-March money that turned up nine months early, and between November and February nothing arrives at all.
The shares stayed put. What changed was where the money sits: €9,000 of the spring payment goes into a separate account, and she pays herself out of it monthly.
Elena is invented, and her figures are illustrative. Investment values can fall as well as rise, and what arrives depends on what the companies vote to distribute and on the charges taken along the way.
So the job is a budgeting one. If most of the money lands in one quarter, the thing you control is the size of the buffer between payments. Choosing holdings for their payment dates is solving the wrong equation.
What changes if you hold a fund instead of shares?
The calendar changes hands and nothing else does. Hold a fund and the dates belong to the fund. Which sounds like a fix. It’s a different problem.
Amundi has published a single notice applying one record date and one ex date (opens in new tab) across a batch of distributing ETFs. They track different markets: the eurozone, the UK, Japan, emerging markets, several bond segments. That works only because the schedule belongs to the fund, not to the companies inside it.
Two dates, settled once, in an office. They decide which month the money reaches every person holding the fund, and none of those people were asked.
The fund can still only hand on what it received. State Street SPDR S&P Euro Dividend Aristocrats UCITS ETF (Dist) holds 40 eurozone companies. Its two largest country weights are Germany at 21.5% and Italy at 19.3%, two of the markets where the once-a-year payment dominates. It distributes twice a year.
Figures as of 30 June 2026; an example, not a recommendation and not advice, so check the current fund documents before acting.
The fund’s own unit goes ex on the fund’s own date. So the mark-down still happens, a layer up.
Whether to hold a distributing fund at all, or an accumulating one, is a separate question covered in how to choose an ETF for a European portfolio.
How much do you need invested to live off dividends in Europe?
Living off dividends takes more than the usual maths suggests, because that maths borrows a yield most European portfolios don’t have. At 4.2% gross, which is a dividend-screened yield rather than a broad European one, €30,000 a year needs about €710,000 invested. At the 2.80% a broad European index yielded in July 2026, the same €30,000 needs about €1.07m.
Same income, €360,000 apart.
Those are illustrative figures and the illustration does a lot of work. Investment values can fall as well as rise. What a portfolio pays out depends on what its companies decide to distribute, and on the charges taken along the way.
A dividend is a choice in a way that rent or a coupon is not. In 2020, 35.2% of the study’s regular dividend payers paid nothing at all.
| Income you want each year | At 2.80% gross | At 3.5% gross | At 4.2% gross |
|---|---|---|---|
| €20,000 | €710,000 | €570,000 | €480,000 |
| €30,000 | €1,070,000 | €860,000 | €710,000 |
Capital divided by yield, rounded to the nearest €10,000, gross of tax and charges. Illustrative only.
The 2.80% column is the one for a diversified European holding. MSCI’s broad European index held 396 companies and yielded 2.80% gross at 31 July 2026. Sift the same list for an above-average yield that looks like it will last (opens in new tab) and 65 companies are left, on 4.17% gross. The gap between those columns has nothing to do with luck or with skill.
It’s the difference between owning 396 companies and owning 65. A screen built to dodge the obvious traps is still a screen, and narrowing what you own runs against spreading money across holdings that do not all move together. The extra 1.4 percentage points of yield is what the narrowing pays.
There’s a second problem behind the annual figure. €30,000 a year arriving mostly in one quarter is not €2,500 a month. If the plan is to live on it, the number you need beside the capital is whatever carries you from July to the following April. Which is not a number anybody puts in a brochure.
Those figures are gross throughout. What reaches your account after withholding tax on dividends, and how to cut it, is less. And if the real question is living off a portfolio at all, the withdrawal side has maths of its own. That’s the 4% rule and what it does and does not promise European retirees.
What are European Dividend Aristocrats?
Companies that pass a named index’s dividend-record test, and there’s more than one such index. The eurozone version asks for at least 10 years in a row of increasing or stable dividends. The best-known American one asks for at least 25 years in a row of increases.
So a European Dividend Aristocrat can be a company that hasn’t raised its dividend in a decade.
The rules are in the documents of the firms whose funds track each index. State Street describes the eurozone one as the 40 highest dividend-yielding eurozone companies that have followed a managed dividends policy of increasing or stable dividends for at least 10 consecutive years (opens in new tab). ProShares describes the S&P 500 version as companies that have increased dividends every year for at least 25 consecutive years (opens in new tab).
Increasing or stable is the phrase doing the quiet work in the eurozone version. Stable counts: a company that has paid exactly the same dividend for 10 years running qualifies. If you took the word Aristocrat to imply a decade of rises, that’s not what it bought.
None of which makes one index better than another. They screen different universes on different tests, and a long streak is a fact about the past rather than a promise about the next 10 years.
Is a high dividend yield a warning sign?
Sometimes a high yield is a warning sign. The way to tell is to ask which half of the fraction moved. A yield is the dividend over the price: it goes up when the company pays more, and it goes up when the price falls. Opposite news, wearing the same number.
The question is never whether 7% is too high. The question is whether this 7% is here because the payment went up, or because the market marked the shares down. In the second case you are looking at last year’s dividend divided by a price that has already fallen, and the board hasn’t yet decided whether to cut it. That is the yield trap, and it tends not to survive the next board meeting.
How often do European companies cut their dividends?
More often than the word reliable suggests. Of the companies in that study paying dividends on a regular schedule before 2020, 35.2% paid nothing at all in 2020. That’s a pandemic year and you can discount it.
The recovery years are the ones that count. In 2022, 24.3% of them were still paying less than they had in 2019, and a further 13.9% were paying nothing at all.
It doesn’t mean a third of European companies stopped for good.
The quarterly payers went a different way, and there are only 53 of them in that comparison. They cancelled far less often in 2020, but 58.5% of them cut the amount. Instead they kept the schedule and shrank the cheque. Which is, in fairness, what most of us would have done.
Are you better off taking dividends or selling shares?
On the maths alone they’re much the same thing, so the honest answer turns on effort. Take €1,000 of dividends and your holding is worth about €1,000 less. Sell €1,000 of the holding and it’s worth €1,000 less. The difference is who picked the date.
That’s worth sitting with, because what most people buy with dividend investing is relief from deciding. The yield comes second. Selling is a decision, and it turns up every time you need money. It comes with a small voice asking whether today is a stupid day to be selling.
A dividend removes the decision outright. Somebody else votes it, company law dates it, the cash appears. Nobody prices that.
The serious case against is about total return, the price move and the dividends counted together, and about what the preference costs you. Research finds that demand for dividend payers rises when interest rates are low and markets are poor (opens in new tab), which is exactly when those shares are dear. The returns afterwards are lower for it.
Against that, a payment you didn’t have to ask for is worth something to a person who needs the income. A return figure has no column for that.
There’s a plainer way to get the cashflow without taking on somebody else’s calendar, and it’s called selling a slice. Take 3% of a holding out over the course of a year and you’ve made the same 3%, on your dates, out of any holding you like, dividend-paying or not.
In practice that’s a sell order for part of a holding, placed through the same broker or platform you’d buy the shares through. You pick the frequency. Once a year into a separate account, paying yourself monthly out of it, is the arrangement Elena is running with her spring payment. Four times a year does the same job. So does twelve.
It costs you the decision, which is the whole point, plus whatever the platform charges to trade. Nobody advertises it because there’s nothing to advertise.
Whether dividend investing in Europe is worth it comes down to what you think you’re buying. You’re buying the removal of a decision. You’re paying for it either with a narrower slice of the European market, or, if you keep the broad one, with an income yield about where the ECB’s deposit rate sits, for now.
Plenty of people will read that and call it a fair price. It is one, if the decision is the thing that has been stopping you.
If it is, the route is ordinary. You buy European shares and dividend funds through a broker or platform authorised in the EU. ESMA publishes the EU-level registers (opens in new tab) if you want to check the one you’re using, and each national regulator publishes its own.
Values can fall as well as rise, and the payment itself gets voted on again next year. Just not in December. December is 1.4% of the once-a-year payments.
Frequently asked questions
Does the share price drop when a dividend is paid?
Why do most German companies pay their dividend once a year?
When in the year do European dividends actually arrive?
What changes if you hold a dividend fund instead of shares?
How much do you need invested to live off dividends in Europe?
How often do European companies cut their dividends?
Sources (16)
- Gesetze im Internet (Bundesministerium der Justiz): Aktiengesetz section 59, Abschlagszahlung auf den Bilanzgewinn
- Gesetze im Internet (Bundesministerium der Justiz): Aktiengesetz section 58, Verwendung des Jahresüberschusses
- Legislation.gov.uk: The Companies (Model Articles) Regulations 2008, Schedule 3, Model Articles for Public Companies, article 70
- European Central Bank Data Portal: deposit facility rate (FM.D.U2.EUR.4F.KR.DFR.LEV)
- Eurostat: HICP all-items annual rate, euro area (ei_cphi_m)
- Borsa Italiana: Data ex dividendo, glossary entry
- STOXX Calculation Guide, April 2026, section 8.1 Corporate Actions
- Kreidl, International Journal of Financial Studies 8(3):58, Stock-Market Behavior on Ex-Dates, New Insights from German Stocks with Tax-Free Dividend
- Ducret, Eugster, Isakov and Weisskopf (2025): The behavior of stock prices around the ex-day during a dividend shortage
- Amundi ETF: Dividends distribution for several ETFs, scheduling notice
- MSCI: Europe Index factsheet, 31 July 2026
- MSCI: Europe High Dividend Yield Index factsheet, 31 July 2026
- State Street Global Advisors: State Street SPDR S&P Euro Dividend Aristocrats UCITS ETF (Dist) factsheet, 31 July 2026
- ProShares: S&P 500 Dividend Aristocrats ETF (NOBL) fund profile
- Hartzmark and Solomon: The Dividend Disconnect (NBER conference version)
- ESMA: EU-level registers and databases
— That's the lot. It is now night.
Want more of this in your Google results?
Add Money Owl as a preferred source, and Google will show our finance pieces higher when you search for them.
By Jure Jaklič
Founder and editor of Money Owl. Data analyst by trade; personal finance learned first-hand across six European countries.
Recommended
The best savings account in Europe is the one that lets you keep the most
The headline rate on a savings account is rarely what you keep. Post-tax yields in Germany, France, Ireland, Slovenia and beyond tell a very different story.

What is financial independence? Not a permanent holiday
Financial independence is a coverage test, not a wealth level: non-work income covers your costs, so work turns optional. Europe changes the maths.