

The point.
- A falling market is a paper loss; it only becomes real the moment you press sell.
- Recovery is a probability, not a guarantee, and it rests on two conditions: broad diversification and time.
- Timing your exit and re-entry usually fails, because the market's best days tend to cluster within days of its worst.
- Near-retirees drawing an income face genuine sequence-of-returns risk, so some planned de-risking is prudence, not panic.
- On a red day: close the app, name the feeling, re-read your plan, check your emergency fund, rebalance rather than liquidate, and keep your contributions running.
The point.
- A falling market is a paper loss; it only becomes real the moment you press sell.
- Recovery is a probability, not a guarantee, and it rests on two conditions: broad diversification and time.
- Timing your exit and re-entry usually fails, because the market's best days tend to cluster within days of its worst.
- Near-retirees drawing an income face genuine sequence-of-returns risk, so some planned de-risking is prudence, not panic.
- On a red day: close the app, name the feeling, re-read your plan, check your emergency fund, rebalance rather than liquidate, and keep your contributions running.
Your tracker is down since you bought in. Every headline says plunge, or rout, or bloodbath, which is a lot of drama for a Tuesday. Your gut says the thing everyone’s gut says: get out, sit in cash, buy back in when it feels calm. Doing nothing feels insane.
The panic hides one thing. A falling market is a paper loss; the only person who can turn it into a real one is you, with a sell button and a bad afternoon. Prices went down. So far, that’s the whole of it.
The finance industry rather likes it when you panic. Frightened people trade, and trading is where the fees live. That is the real reason to learn how to handle market volatility, the ordinary up-and-down of prices, without becoming the thing that sinks your own plan. No pep talk, and no “your future self will thank you”. We’re on your side, and a little cross on your behalf.
If your thumb is hovering over sell right now, the whole of the advice is one line: do nothing today that you cannot undo. The six-step drill waits at the end, under what to do on a red day; everything between here and there is the why.
Why do markets fall, and is any of this normal?
Markets fall because prices move every second on new information and shifting mood, and sometimes the mood curdles. This is normal. A drop of 10% to 20% is a correction; past 20% from the recent high, it’s a bear market. Both are routine, expected features of investing.
Most days, that’s dull. Now and then it turns ugly, selling feeds on itself, and a few per cent down becomes the top story. It is written into EU investor-protection law under MiFID II, and every national regulator says the same thing: the value of your investment can go down as well as up. That is not investing going wrong. That is investing.
How often? On roughly a century of US market history, a bear market has arrived about every three and a half years over the full record, and less often, roughly every five years, since 1945. On average it has taken shares down around 35% and lasted nine to ten months before recovery began. The same Ned Davis Research count has shares rising in about 78% of the 95 years to 2025 (Ned Davis Research, via Hartford Funds (opens in new tab)). Those figures are illustrative and US-based. The falls are loud and the rises quiet, which is why falls feel more common than they are.
What is happening in your head on a red day?
Five well-documented biases hijack a red day: loss aversion, recency bias, herd behaviour, myopic loss aversion, and action bias. Each makes selling feel urgent and sensible. None is a character flaw. They’re standard-issue human wiring, and naming them takes most of their power away.
The first is loss aversion. A loss hurts more than the same-sized gain feels good (FCA Occasional Paper No.1 (opens in new tab)), though researchers still argue over how much more. Either way, a portfolio down 12% doesn’t register as 12%; it registers as an emergency. The same pattern holds across cultures: a study across 19 countries and 13 languages found it nearly everywhere (Ruggeri and colleagues, 2020 (opens in new tab)). Frankfurt, Cork or Lisbon, the wiring is the same.
Recency bias comes next. Whatever just happened, your brain assumes will keep happening. Three bad weeks feel like the start of forever, and a long boom feels permanent right up until it isn’t (OECD (opens in new tab)).
Then herd behaviour. When everyone’s selling, selling feels safe, because we’re social animals who once did well to run when the herd ran. Running with the herd made sense on the savannah; on a trading screen it mostly books your loss, and the stampede tends to reverse within days. ESMA (opens in new tab) found that social-media-driven overreactions on European shares are typically gone within about a day.
Myopic loss aversion is loss aversion plus a phone. Check that falling portfolio more often, and you rack up more losing moments, so the shares start to feel riskier, even though nothing about the long game has changed (Benartzi and Thaler (opens in new tab)). Checking hourly is how you talk yourself into a decision the decade would never suggest.
Action bias is the loud one: the plain need to do something. We regret bad outcomes that follow sitting still more than identical ones that follow action, so standing there while the number falls feels like negligence (Bar-Eli and colleagues (opens in new tab) found even elite goalkeepers dive on a penalty when staying put would save more). Doing nothing is a decision. It gets no credit.
| Bias | The mistake it triggers | The counter-move |
|---|---|---|
| Loss aversion | A 12% dip lands like an emergency, so you sell to stop the ache | Name it out loud; a paper loss only turns real when you sell |
| Recency bias | Three bad weeks feel like the first act of forever | Re-read your written plan and your five-year-plus horizon |
| Herd behaviour | Everyone is selling, so selling feels like the safe thing | The crowd is not information; social-media-driven falls on European shares typically reverse within a day |
| Myopic loss aversion | Checking hourly stacks up losing moments and inflates the felt risk | Close the app; you will not catch the bottom by staring |
| Action bias | Standing still feels like negligence | Doing nothing is a decision; rebalance to a rule if you must act |
Should I sell when the market is down?
Right now, almost certainly not. The longer answer is that it depends on why you would sell, because dodging the bottom means being right twice, when to get out and when to get back in, and the maths is unkind to people who try.
A badly-timed sale is what Vanguard (opens in new tab) calls turning a temporary negative return into a permanent impairment of the balance, a polite way of saying the selling is what makes the loss stick.
So ask the sharper question: why would I sell? Four questions sort panic from plan. Do I need this money in the next few years? If yes, it shouldn’t be in shares, and moving it out is the prudent thing to do. Am I still paying in, or drawing out? Am I rebalancing to a plan I set in the calm, or reacting to a number? Has anything changed except the price? If only the price moved, last month’s plan is still right.
Already sold? You’re in good company; park the guilt. Worth knowing, though: sitting in cash until it feels calm is the same timing bet as before, and the best days tend to land next to the worst. The way back is dull, a written plan and steady contributions, settled in the quiet rather than another snap decision. If you are sitting on a large cash pile, feeding it back in on a fixed schedule rather than all at once takes the timing bet off the table in both directions.
Can I sell now and buy back at the bottom?
Rarely well. The calm never rings a bell, and the market’s best days cluster within a fortnight of its worst. A seller waiting for things to settle is left holding cash through the rebound. To win, you must be right twice.
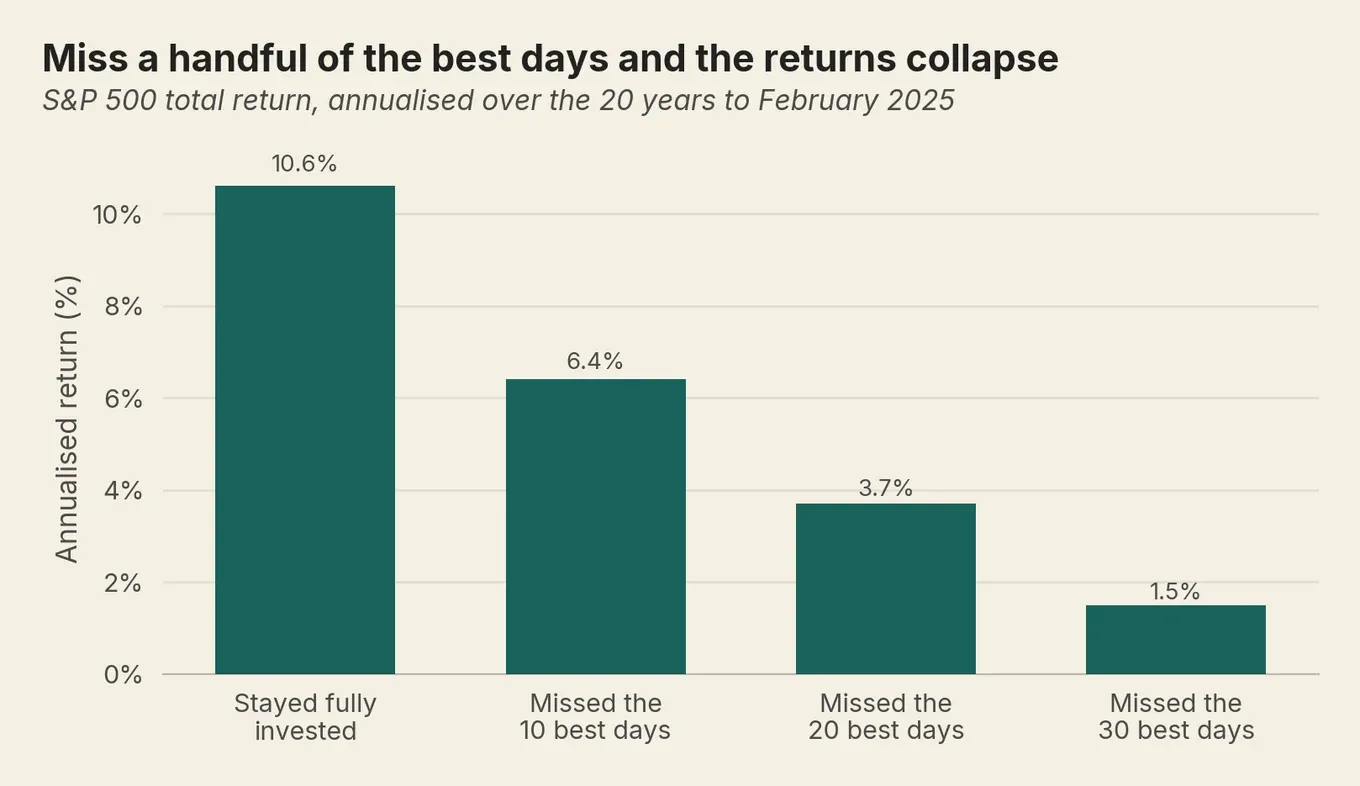
The numbers make the trap concrete, so read the qualifiers first, because they carry the point: over the 20 years to February 2025, a fully invested holding in the S&P 500 returned about 10.6% a year; miss the 10 best days and that drops to 6.4%; miss the 30 best and you’re at 1.5% (J.P. Morgan Private Bank (opens in new tab), illustrative and US-based). These are illustrative figures, investment values can fall as well as rise, and actual returns depend on the fund you hold and its charges. The sting: seven of those 10 best days landed within 15 days of the 10 worst. Sell into the storm, and you’re likely to be in cash for the rebound.
You may have heard that the average investor underperforms the funds they own through badly-timed trades. It’s real, but mind the size. Morningstar’s “Mind the Gap” put the shortfall at about 1.2% a year over 2015 to 2024; a peer-reviewed 2026 paper in the Financial Analysts Journal re-ran the same data and found the true cost nearer 0.10% a year (Fulkerson and colleagues (opens in new tab)). Bad timing costs you something, but anyone quoting a precise, scary figure is more confident than the evidence allows.
How long do crashes last, and do markets always recover?
Recovery from crashes has been the strong historical norm for a globally diversified portfolio, though it has never been guaranteed. The timing swings widely: a euro investor in a world tracker recovered inside 2020 at the fast end and waited well over a decade at the slow end. Diversification and time are the conditions.
What makes recovery likely rather than guaranteed?
Two things: broad diversification and time. A globally spread portfolio held for years has nearly always recovered, while a single-country or single-stock bet has sometimes stayed underwater for decades. That gap is the whole distance between likely and guaranteed.
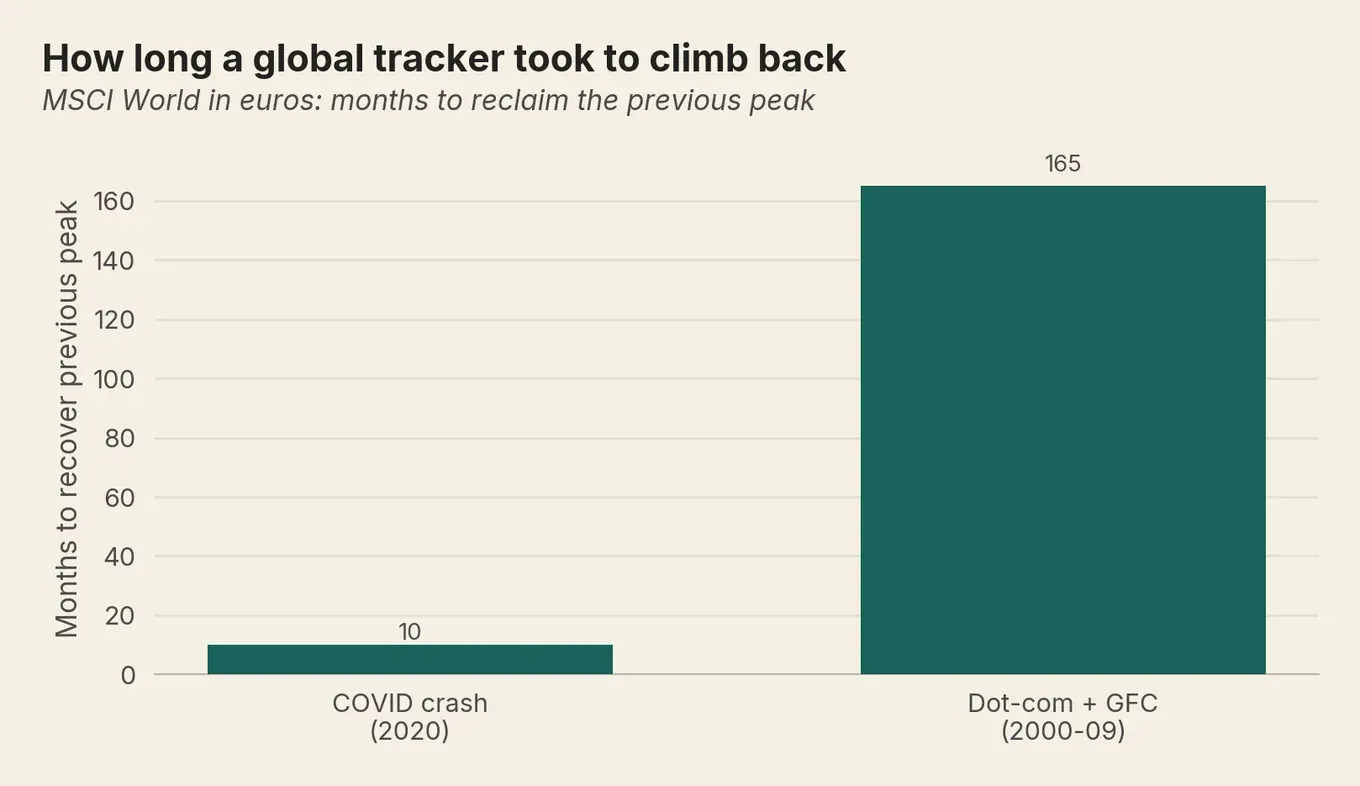
A euro investor in a global tracker (MSCI World measured in euros) saw the sharp COVID crash of early 2020 fully recovered within the same calendar year, the index up about 7% in euro terms across 2020. That’s the fast end. At the slow end, the same kind of holding fell around 56% from its 2000 peak and took roughly 165 months, near enough 14 years, to climb back. The figures come from aggregated EUR index data at LazyPortfolioETF (opens in new tab), illustrative, as of 30 June 2026; values can fall as well as rise, and real returns depend on charges. Months at best, well over a decade at worst.
One euro-only wrinkle sits underneath: in 2022 a world tracker fell about 13% in euro terms against roughly 18% in dollars, because a strong dollar cushioned the euro holder. The euro headline is not the dollar headline.
Over the long run, the case for staying put is strong. Across 125 years and dozens of countries, global shares returned about 5.2% a year after inflation, against 1.7% for bonds and 0.5% for cash (Dimson, Marsh and Staunton for UBS (opens in new tab), corroborated by Cambridge Judge Business School (opens in new tab)). Equities beat bonds, bills and inflation in every country studied. Averages aren’t handed out evenly, mind: on the same UBS Yearbook figures, so far this century, through 2024, that real return has been nearer 3.5%. Timing earns you nothing here. Sitting still does the work. Warren Buffett reduced the discipline to one sentence in his 1986 letter to Berkshire Hathaway shareholders (opens in new tab):
We simply attempt to be fearful when others are greedy and to be greedy only when others are fearful.
That’s a temperament, not a timing instruction.
Now the caveat that rarely gets stated plainly. Recovery has been highly likely. It has never been a certainty. The CFA Institute’s Edward McQuarrie (opens in new tab) went back through expanded international records and found shares are not guaranteed to make money even over 20 years. Across roughly 19 non-US markets, there have been multiple stretches where equities lost to inflation over 20, 30, and more rarely 50 years.
Two things hold the reassurance up: diversification, meaning globally and not one country or one stock, and time. “Markets always recover” is a promise about a diversified, long-horizon portfolio. Say it to someone holding a single share and you’re lying to them.
Bolting to cash feels like safety. Over long stretches it quietly isn’t: the number doesn’t fall, but inflation eats it and you give up the equity premium, the extra long-run return shares have paid over cash. Safe from the drop, exposed to the erosion.
Is “just hold” right for me?
Not for everyone. If you’re years from needing the money and still paying in, holding is the right call, and a falling market is quietly buying you future units more cheaply, provided you are not carrying expensive, unmanageable debt. Clearing that almost always beats any likely market return, so it comes first, ahead of fresh contributions. Near retirement, about to draw an income? Then a bad run early on does lasting damage, and some de-risking is simply prudent.
The instinct hit Jonas hard the first time his tracker fell: stop the €300 monthly contribution, sell, wait for calm. At 34 and near Frankfurt, he had never seen a red year before. Instead, he kept paying in.
Before the drop, units cost about €100, so €300 bought three. Near the bottom, units cost about €60, so the same €300 bought five. When prices climbed back toward €100, those cheap units carried the recovery. A colleague who sold at €60 crystallised the loss, sat in cash, and bought none of them. Illustrative only; values can fall as well as rise, and real returns depend on the fund and its charges.
When is it rational to de-risk?
When you’re close to drawing an income. A near-retiree faces sequence-of-returns risk, where a bad early run does lasting damage. There are a few dull, effective answers, flexible withdrawals among them, and each works best set up well ahead of time.
Almost every guide tells you to hold and ignore the noise. For a saver still paying in, that’s right. There’s one reader it fails, though, and it rarely gets said plainly. Bríd is 61, near Cork, about to draw an income from her pension pot. She faces what an accumulator, a saver still paying in, doesn’t: that same sequence-of-returns risk, where the order of your returns matters as much as the average. A deep fall in the first few years of drawdown makes her sell more units while they’re cheap, leaving less capital to recover. Meet the same bear market ten years later and she might barely feel it.
An illustrative example, fully caveated. Take two euro-area retirees who each start with €300,000 and draw €15,000 a year. Give them the same 25 years of returns, but in opposite order. The one who hits a deep bear market in years one to three can run out of money years before the one who meets it near the end, despite identical average returns.
This is illustrative only, values can fall as well as rise, and the outcome depends on actual returns, their order, charges and inflation. Her calculus genuinely differs from the 30-year saver’s. Nobody here is telling her to sell everything.
For her, some de-risking is planning, not panic. A cash buffer of a year or two’s spending, roughly €30,000 for someone drawing €15,000 a year, so she never has to sell shares in a slump. Flexible withdrawals that ease off in bad years. A slow glide toward steadier assets as drawdown nears. All decided in the calm, not on a red day. If she wants a personal steer, the sensible move is a financial adviser authorised by her national regulator, checked on the public register (the Central Bank of Ireland (opens in new tab) in her case, BaFin in Germany, and so on). We hand over the framework. We do not sell the product.
What should I do on a red day?
When the market is falling and your thumb is hovering over sell, here’s the checklist. None of it is clever. Dull is the whole point.
- Close the app. Checking hourly only feeds myopic loss aversion; you won’t catch the bottom by staring, and looking makes it worse.
- Name the feeling, out loud if you have to. “This is loss aversion” and “this is the herd” genuinely drain the urgency.
- Re-read your written plan and your time horizon. If you won’t need this money for five years or more, a widely-shared minimum for money held in shares, a bad month is noise.
- Check your emergency fund covers the near term. If you’re never forced to sell to cover a bill, you can afford to wait.
- Rebalance rather than liquidate if you must act. Trimming what has grown to top up what has fallen is a rules-based discipline. Selling the lot because you’re scared is not.
- Keep your automatic contributions running, once step 4’s buffer is in place. If it is not, build that cash first, because a crash and a lost job have a habit of arriving together. Paying a fixed amount each month then takes the buy-or-not decision away from the worst moment to make it.
The market doesn’t know you’re watching, and it isn’t doing this to you. It’s repricing, the way it always has, and on the evidence it will probably, though not certainly, do the repairing too. Your job on the red day is smaller and duller than the panic makes it feel. Set the contributions, close the tab, and let the boring plan be boring. The real product was never the extra percent. It was having one less thing to lie awake about.
Frequently asked questions
What should I do when the stock market is volatile?
Should I sell when the market is down?
How long do market crashes last, and do markets always recover?
How do you stay calm during a market crash?
Sources (17)
- Financial Conduct Authority: InvestSmart, risk and returns
- Financial Conduct Authority: Occasional Paper No.1, behavioural economics
- Columbia University Mailman School of Public Health: global loss-aversion study (Ruggeri and colleagues)
- OECD: behavioural economics and financial consumer protection
- ESMA: social media sentiment and its influence on EU equity prices
- NBER: Myopic Loss Aversion and the Equity Premium Puzzle (Benartzi and Thaler)
- Hebrew University of Jerusalem: Action Bias among Elite Soccer Goalkeepers (Bar-Eli and colleagues)
- Vanguard: safeguarding retirement in a bear market
- J.P. Morgan Private Bank: ways to strengthen a portfolio for unpredictable markets
- CFA Institute, Financial Analysts Journal: bad timing does not cost investors 15% of returns (Fulkerson and colleagues)
- LazyPortfolioETF: iShares Core MSCI World UCITS ETF (EUR) metrics
- UBS Global Investment Returns Yearbook 2025 (Dimson, Marsh and Staunton)
- University of Cambridge Judge Business School: stocks have far outperformed over 125 years
- CFA Institute: Stocks for the Long Run, setting the record straight (McQuarrie)
- Hartford Funds: things to know about bear markets (data: Ned Davis Research)
- Berkshire Hathaway: 1986 letter to shareholders (Warren Buffett)
- Central Bank of Ireland
— That's the lot. It is now night.
Want more of this in your Google results?
Add Money Owl as a preferred source, and Google will show our finance pieces higher when you search for them.
By Jure Jaklič
Founder and editor of Money Owl. Data analyst by trade; personal finance learned first-hand across six European countries.
Recommended

Mental accounting: why a euro from a refund spends differently
A euro is a euro, but your brain files it into pots and spends each by a different rulebook. Spot the pots quietly costing you, keep the ones that save you.

How to teach your brain to delay gratification
Delayed gratification is a skill, not a flaw you were born with. Four small levers turn it into a saving habit instead of a daily willpower fight.

Why you can't save money (it was never willpower)
You keep failing the willpower test because it was never a willpower test. Change the set-up, automate one transfer, and saving happens without you.