

The point.
- Roughly six euro-area households in seven hold no investment fund, which is a spread rather than an absence. A simple tax-favoured savings and investment account exists in some member states and not in others, and that is a policy choice rather than a personality trait.
- The state pension is a promise, and nobody owns a promise. The ECB's survey of household wealth excludes public and occupational pension plans from what it measures, so the biggest thing most Europeans are counting on never appears in the figures.
- Saving hard and ending up wealthy turn out to be two different achievements. Across eleven European markets the ranking by gross saving rate and the ranking by median household wealth do not track each other.
- Add up all euro-area household assets and about €66 in every €100 is property, about €9 is money in the bank, and about €5 is shares and investment funds. That is the area's total added together, not a typical household's portfolio.
- In June 2026 euro-area households were paid 0.28% a year on overnight deposits, while euro-area prices over the previous twelve months had risen 2.8%. A deposit guarantee protects the number. It says nothing about what the number buys.
- Germany is the highest-renting market in this set, with 46.8% of people renting at market rate. A renter starts no conversion, so every conversion has to be a deliberate one.
The point.
- Roughly six euro-area households in seven hold no investment fund, which is a spread rather than an absence. A simple tax-favoured savings and investment account exists in some member states and not in others, and that is a policy choice rather than a personality trait.
- The state pension is a promise, and nobody owns a promise. The ECB's survey of household wealth excludes public and occupational pension plans from what it measures, so the biggest thing most Europeans are counting on never appears in the figures.
- Saving hard and ending up wealthy turn out to be two different achievements. Across eleven European markets the ranking by gross saving rate and the ranking by median household wealth do not track each other.
- Add up all euro-area household assets and about €66 in every €100 is property, about €9 is money in the bank, and about €5 is shares and investment funds. That is the area's total added together, not a typical household's portfolio.
- In June 2026 euro-area households were paid 0.28% a year on overnight deposits, while euro-area prices over the previous twelve months had risen 2.8%. A deposit guarantee protects the number. It says nothing about what the number buys.
- Germany is the highest-renting market in this set, with 46.8% of people renting at market rate. A renter starts no conversion, so every conversion has to be a deliberate one.
In the euro area, 99.1% of households hold money in a bank. Only 14.2% hold an investment fund. Roughly six households in seven hold no fund at all.
Hard to call that a personal failing.
The explanation offered, every time, is that Europeans are cautious. Fine. That’s some of it. The balance sheet has a duller answer: the money already went somewhere.
Of every €100 of assets held by euro-area households, about €66 is property. About €9 is money in the bank. About €5 is shares and investment funds.
That’s a receipt for the whole euro area (opens in new tab): every household’s assets added up and cut into slices. It’s not a picture of one ordinary household, because the largest holdings pull a total around. Worth knowing before anyone reads their own life into it.
Every slice on that list is there because money was turned into something and left. Saving decides how fast the account fills. What the money gets turned into decides everything after that.
Why do so few European households own investments?
Because the causes mostly sit outside the household.
Six in seven is an average, and averages flatten things. Direct shareholding is thinner still, 11.4% across the euro area, about one in nine. German households beat both averages comfortably, 23.7% in funds and 17.6% in shares. Finnish ones beat everybody. The habit is unevenly spread rather than absent.
The ECB has gone looking for why households hold what they hold, and the finding is gloriously unexciting: people save out of caution and habit (opens in new tab) rather than as a calculation about returns. Which is inconvenient for an industry built almost entirely on explaining returns.
Tax came up in the same work. Not helpfully, if you were hoping to blame it.
Countries with some of the highest levels of tax … have highly developed capital markets (Ireland, Denmark, Sweden), while countries with low tax levels tend to be those with less sophisticated markets.
European Central Bank, Euro area household savings allocation and the role of taxation (opens in new tab)
Backwards. What varies most is the market people happen to live in. The European Commission’s work on savings and investment accounts (opens in new tab) notes that a simple, tax-favoured account for ordinary savers exists in some member states and not in others. A national design decision, made years ago, by people you’ve never met.
Does saving harder make European households wealthier?
Not on its own, no.
Europeans save, they save diligently, and they have been told for years that this is the whole job. It stops being the whole job the moment the money lands somewhere.
Saving hard and ending up wealthy turn out to be two different achievements. Put eleven European markets side by side and the rankings refuse to line up.
| Market | Gross saving rate, 2024 | Median household net wealth |
|---|---|---|
| Austria | 17.9% | €124,700 |
| Belgium | 13.1% | €254,200 |
| Finland | 11.9% | €96,000 |
| France | 18.2% | €149,000 |
| Germany | 19.9% | €103,300 |
| Ireland | 13.4% | €258,100 |
| Italy | 11.2% | €162,800 |
| Netherlands | 16.9% | €143,500 |
| Portugal | 12.3% | €151,800 |
| Slovenia | 13.5% | €154,500 |
| Spain | 12.8% | €151,600 |
Sources: Eurostat (opens in new tab) gross saving rate, 2024; ECB household survey (opens in new tab), wave published June 2026. A yearly flow standing next to a stock.
Two columns, neither of them quite what it looks like. The saving rates are gross, so higher than the net rate Germany’s own statistics office (opens in new tab) publishes, and they are all 2024, while these wealth figures were collected between October 2022 and June 2024 (opens in new tab). The wealth column counts households rather than people, which flatters the countries with more people per household (in the same ECB tables (opens in new tab) two in five German households are one person, against one in three Italian ones), and workplace pension money counts as saving on the left (opens in new tab) and is missing on the right, for the reason set out below. The ECB’s own notes warn that comparisons like these need care.
Ireland and Belgium save middling amounts and sit at the top of the wealth column. The hardest savers here are nowhere near it.
Where does European household wealth actually sit?
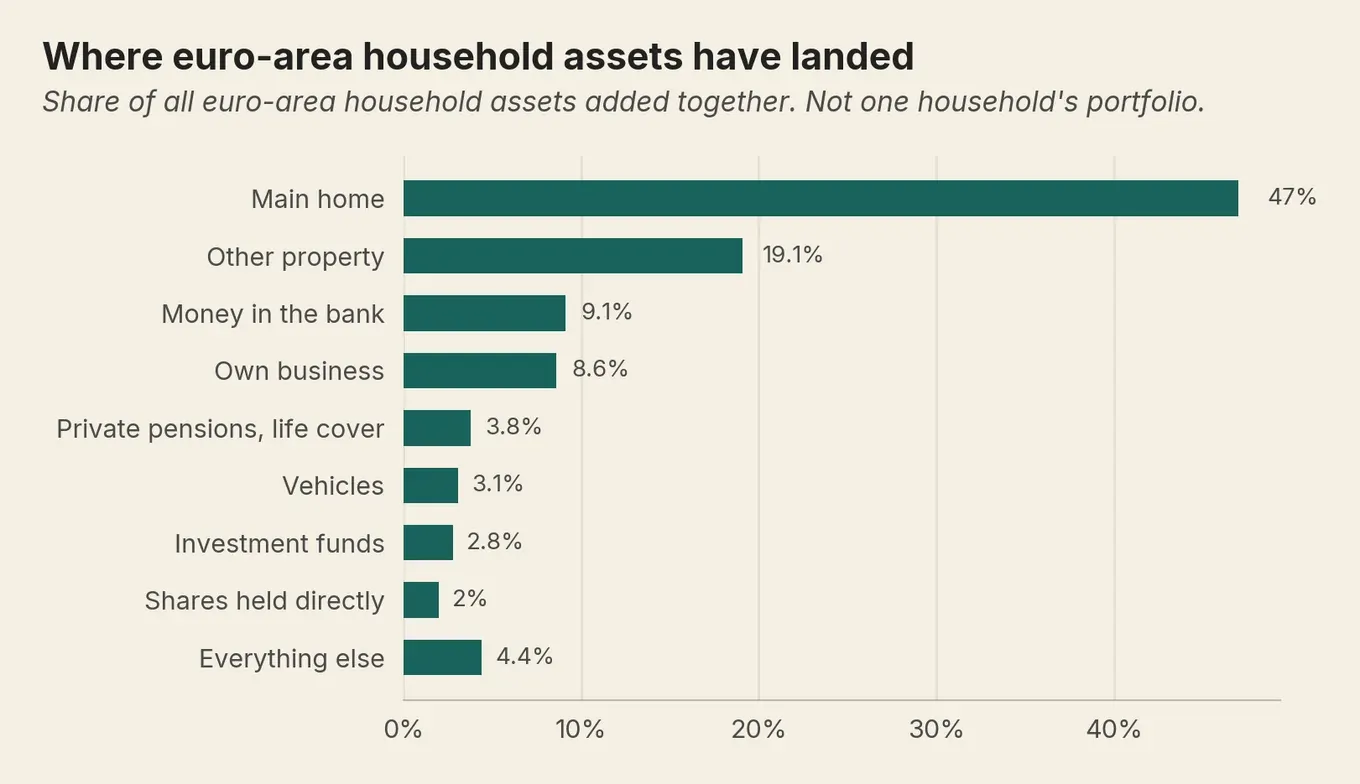
Property. About two thirds of everything euro-area households own is property, and the biggest single slice is the one they live in.
Why does a home not behave like an investment?
Because the return on a home arrives as somewhere to live rather than as money, and you can’t spend it without moving out of it. The house wasn’t a mistake. It’s doing the job it was bought for, which is keeping the rain off.
That reading is borrowed. The ECB’s economists (opens in new tab) note that when house prices rise, households may be less inclined to sell a home than to sell shares, partly because the transaction costs are higher.
Most people are in it, too. In 2025, 68.5% of people in the EU (opens in new tab) lived in a home their household owned, and 43.7% owned it outright against 24.8% with a mortgage. Nearly two to one.
The Netherlands runs the other way: 57.9% own with a mortgage and only 10.9% outright, the most mortgaged market in this set. Italy sits at the other end, with 59.9% owning outright. One country still paying, one country finished.
Who owns and who rents also decides where a country’s median lands. Take Germany and Italy. In the ECB’s survey, 41.8% of German households own their home, against 74.5% of Italian ones.
Now split each country by tenure. German owners hold more than Italian owners at every step: €445,900 against €220,000 outright, and €380,800 against €188,200 with a mortgage. German renters hold €18,400 against €8,400. So every German group is ahead of its Italian counterpart, and the country still comes out behind. Germany’s overall median lands lower because so little of Germany sits in the group that owns. The median is reporting on tenure, not on anyone’s competence.
A mortgage does something else, quietly. Every payment splits in two, and the principal half turns income into an asset with nobody deciding anything. It’s the one conversion in most European households that runs on its own. There’s an end date, though. When the mortgage ends the conversion stops. The money carries on arriving.
What happens instead if you rent?
Nothing. That’s the whole of it. A renter starts no conversion, so every conversion has to be a deliberate one, and that is the entire difference between the two. It is considerably duller than the argument people insist on having about renting.
Germany is where this bites hardest. In Eurostat’s 2025 count, 47.2% of people there lived in an owned home and 46.8% rented at market rate. Near enough a dead heat, and by far the highest share of renters in this set. Half a country that has to do all of it on purpose.
Why is the state pension missing from these figures?
Because a state pension is a promise, and nobody owns a promise.
The ECB’s survey of household wealth lists what counts as a financial asset, then adds one line: the current value of public and occupational pension plans is not included. So the biggest thing most Europeans are counting on for retirement never appears in the wealth figures at all.
Which raises the daft question of where the pension actually is. It isn’t anywhere. Most Europeans hold a large part of their retirement provision as a promise from the state rather than as an asset they own, and today’s workers pay today’s pensioners, so the promise is a claim on the workers who come after you. There’s no pot with your name on it to value.
Workplace pensions are left out for a different reason. The OECD (opens in new tab), which leaves them out too, says comparable data across countries are unlikely to be available. Plenty of them hold real money. Nobody is hiding it; it just isn’t counted here, which matters mostly when you start holding your own number up against a national one.
Finland shows how much that exclusion can move. Finnish households invest more than any other market in the table above: 39.1% hold a fund and 25.0% hold shares directly, against euro-area averages of 14.2% and 11.4%. Some of that lead is measurement rather than behaviour. Finland reads most financial holdings straight off registers while other countries ask households, and asking under-records.
Yet Finland shows the lowest median in that same table, €96,000. A lot of Finnish wealth sits where this survey doesn’t look. The statutory earnings-related pension is partly funded, and at the end of 2025 it held €285 billion (opens in new tab), a national total rather than a figure any one household owns. None of it is in the €96,000.
The ECB’s survey (opens in new tab) puts median euro-area net wealth at €140,100. Among the households that hold money in a bank, and nearly all of them do, the middle one holds about €10,000. Both worth holding up next to the net worth you track yourself, if only to see which one you were quietly comparing yourself to.
Why doesn’t saving turn into wealth on its own?
Conversion. Saving is a flow, wealth is a stock, and the only thing joining them is what the flow gets turned into. Which is why two households on the same income, saving the same share of it, can end up years later in completely different places.
Then there’s the destination nearly every household has. A deposit’s whole promise is that the number won’t fall, and the promise is backed: European deposit guarantee schemes protect deposits of up to €100,000 (opens in new tab), per depositor, per bank. What that protects is the number. On what the number buys, the guarantee has nothing to say. It does exactly what it says on it, and it says a good deal less than most people think it says.
The gap shows up in the ECB’s own rate statistics (opens in new tab). In June 2026, euro-area households were paid 0.28% a year on overnight deposits, the everyday balance most household money sits in, while euro-area prices over the twelve months to that month had risen 2.8% (opens in new tab). For as long as both stay near those levels, that’s a real loss of roughly 2.5 percentage points a year. The number holds. The purchasing power quietly doesn’t. Moving to a better-paying account narrows that gap and doesn’t close it.
The choice was never between risk and safety. It was between two risks. A deposit carries no risk of the number falling and full exposure to what the number is worth. A growth asset carries the reverse. Most people were told the first was the absence of risk.
How much should stay in reachable cash is a separate question, and the answer is never zero. Months of ordinary outgoings, not weeks, sitting where you can get at it within a day. We take that one apart in a piece on liquidity.
What changes if you convert even a small share?
The European Commission ran the comparison over a real historical period rather than an invented projection, which is rarer than it ought to be. From the start of 2009 to the end of 2024, it reports (opens in new tab), an investment in the European stock market would have grown by more than 50% net of inflation.
The same money held in deposits would have lost more than 10% of its real value.
Put the €10,000 from earlier through that. Left in deposits from 2009, it would have been worth under €9,000 in today’s money by 2024. In the European stock market, over €15,000. Same sixteen years, same money, two destinations.
That’s an illustrative past-period figure, not a forecast. Investment values can fall as well as rise, and actual returns depend on fund performance and charges. Tax comes off too, and varies by market; the Commission doesn’t say whether its figures are net of it. A different period would give a different answer.
What the comparison sizes is the decision, and the decision only ever covers money that has no job for a decade. Nobody’s saving effort is in that calculation. The account did the one thing it was built to do, which was hold the number steady. Whether to move now or wait is a different argument again.
Which of your money this is about comes down to a subtraction, and it takes ten minutes. Start with everything you hold.
Take out the buffer you need to reach quickly, sized to how steady your income is; a salary and a freelance year don’t need the same cushion. Then any debt costing you more than a savings account pays, because clearing that is a saving you can count on and an investment return is not.
Then anything you’ll need inside the next ten years. All ten of them, not the next two or three. What’s left is the money with a ten-year horizon on it.
Worth asking of what’s left: was it put there on purpose, or did it just end up there? On purpose is a perfectly good answer. A house deposit, or a year that looks shaky, and cash is exactly where it should be. Nobody is grading this.
If you do go looking, check first whether the firm is authorised at all; ESMA links to every national regulator’s public register (opens in new tab), and it takes about a minute. Values can fall as well as rise, whichever way you answer.
Frequently asked questions
Why don't Europeans invest in stocks?
How much should I keep in cash before investing any of it?
Where does European household wealth sit?
What is the difference between income and wealth?
Is my money losing value sitting in a savings account?
Sources (14)
- European Central Bank: Household Finance and Consumption Survey, Wave 2023, statistical tables
- Eurostat: gross household saving rate, key indicators for sector accounts (nasa_10_ki), 2024
- Eurostat: distribution of population by tenure status (ilc_lvho02), 2025
- Eurostat: household saving rate, reference metadata (tec00131), definition of gross saving and the adjustment for the change in pension entitlements
- European Central Bank: household wealth and consumption in the euro area, Economic Bulletin 1/2020
- European Central Bank: euro area household savings allocation and the role of taxation
- ECB Data Portal: MFI interest rate statistics (MIR), euro-area household deposit rates
- Eurostat: flash estimate, euro area annual inflation, July 2026
- European Commission: deposit guarantee schemes
- European Commission: factsheet on savings and investment accounts
- ESMA: check whether a firm is regulated, national register directory
- OECD Wealth Distribution Database, main concepts and definitions
- Finnish Centre for Pensions (ETK): investment of earnings-related pension assets, year-end 2025
- Statistisches Bundesamt (Destatis): German household saving rate, press release N059, 28 October 2025
— That's the lot. It is now night.
Want more of this in your Google results?
Add Money Owl as a preferred source, and Google will show our finance pieces higher when you search for them.
By Jure Jaklič
Founder and editor of Money Owl. Data analyst by trade; personal finance learned first-hand across six European countries.
Recommended

How to track your net worth: a monthly guide for Europeans
Track net worth across countries and currencies with one home currency, one rate source, and one date each month. A plain, repeatable habit.

Saving for short-term vs long-term goals: where to put your money
Match each pot to its timeline: keep one-year money in cash, five-year money in government bonds, and ten-year-plus money in diversified funds.

Liquidity in personal finance: which of your own money can you reach?
Liquidity is which of your own money you can actually reach. Map it onto European wrappers, then size the cash buffer none of the locked stuff can rescue.