

The point.
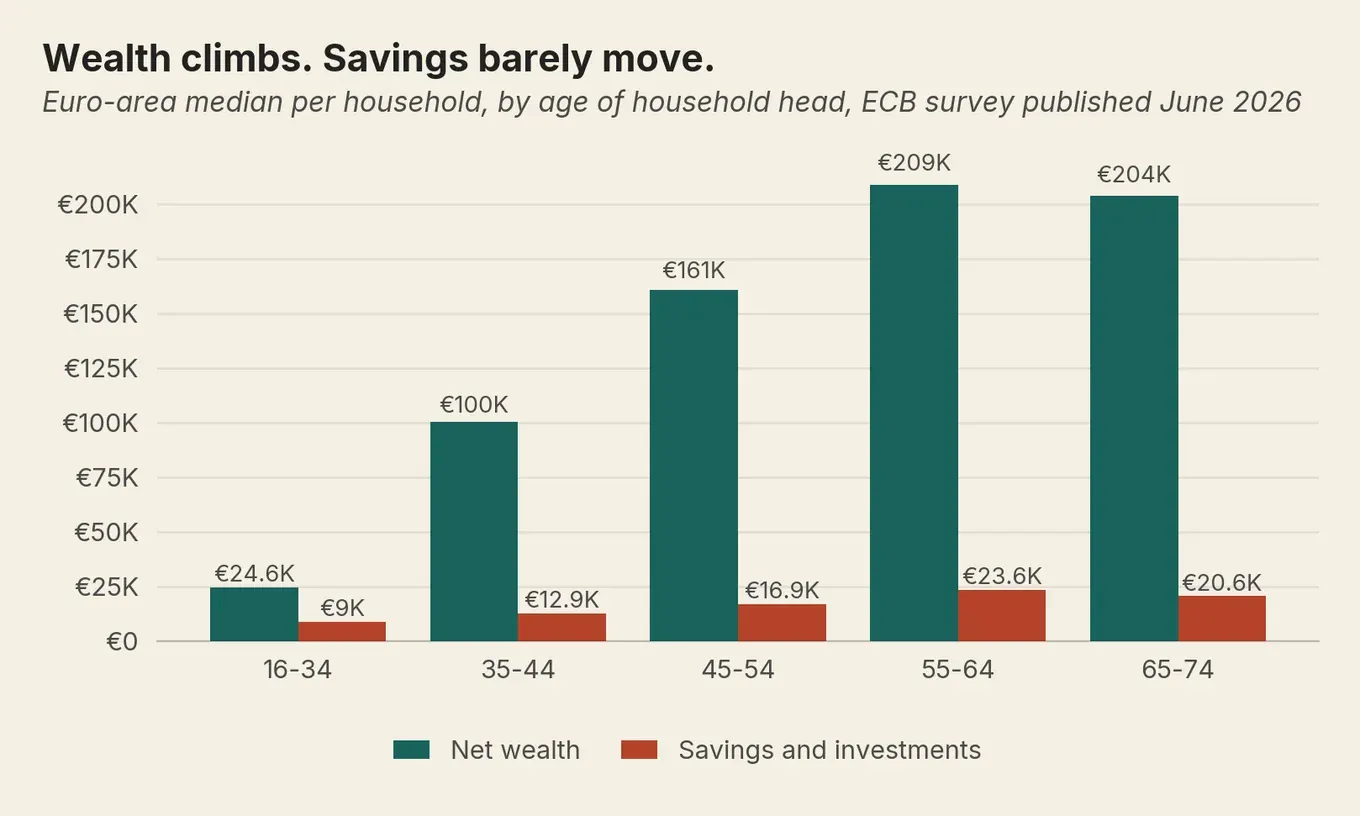
The typical euro-area household aged 35 to 44 holds about €100,400 in net wealth. Its savings and investments come to only about €12,900. Both are medians per household, not per person, and the gap is mostly the house.
The survey behind those figures does not count what you have built up in a state or workplace pension. The ECB leaves out the current value of public and occupational pension plans by definition, which leaves countries with the biggest workplace schemes looking thinner here than they are.
The American rule, one times salary by 30, three by 40, six by 50, exists because compulsory US pensions replace about 51% of an average earner's income. Across the EU the compulsory figure is about 68%. So the imported target is too high for much of Europe. Not everywhere, mind: Germany sits level with the United States, and Ireland sits below it.
Compulsory does not mean state. The Netherlands reaches about 96% because roughly nine in ten employees sit in an automatic workplace scheme, not because its state pension is enormous. Ireland's 33.7% counts the state pension alone; add a full-career voluntary pension and the modelled figure reaches about 72%.
Germany, the Netherlands, France, Ireland, Italy, Spain, Portugal and Slovenia each run a free official pension service. Germany's rentenuebersicht.de shows state, workplace and private entitlements together from age 27. The Netherlands, France, Italy, Spain, Portugal and Slovenia all project an amount. Ireland's MyWelfare gives you a contribution record instead, which you read against the state pension rate bands yourself.
Housing tenure moves the wealth figures harder than age does. Euro-area households who own outright hold a median €292,900; renters hold €14,100. Owners are older and earn more, though, so that gap says nothing about what buying would do for you.
The point.
The typical euro-area household aged 35 to 44 holds about €100,400 in net wealth. Its savings and investments come to only about €12,900. Both are medians per household, not per person, and the gap is mostly the house.
The survey behind those figures does not count what you have built up in a state or workplace pension. The ECB leaves out the current value of public and occupational pension plans by definition, which leaves countries with the biggest workplace schemes looking thinner here than they are.
The American rule, one times salary by 30, three by 40, six by 50, exists because compulsory US pensions replace about 51% of an average earner's income. Across the EU the compulsory figure is about 68%. So the imported target is too high for much of Europe. Not everywhere, mind: Germany sits level with the United States, and Ireland sits below it.
Compulsory does not mean state. The Netherlands reaches about 96% because roughly nine in ten employees sit in an automatic workplace scheme, not because its state pension is enormous. Ireland's 33.7% counts the state pension alone; add a full-career voluntary pension and the modelled figure reaches about 72%.
Germany, the Netherlands, France, Ireland, Italy, Spain, Portugal and Slovenia each run a free official pension service. Germany's rentenuebersicht.de shows state, workplace and private entitlements together from age 27. The Netherlands, France, Italy, Spain, Portugal and Slovenia all project an amount. Ireland's MyWelfare gives you a contribution record instead, which you read against the state pension rate bands yourself.
Housing tenure moves the wealth figures harder than age does. Euro-area households who own outright hold a median €292,900; renters hold €14,100. Owners are older and earn more, though, so that gap says nothing about what buying would do for you.
The typical euro-area household in its late thirties is worth about €100,400. It also has about €12,900 in savings and investments. Both numbers are true at once, and the difference between them is a house.
Neither is the number you came for. The number you came for is a rule: one year’s salary saved by 30, three times by 40, six times by 50. It’s tidy. It’s memorable. It fits on a graphic.
It’s also American, and it was built to solve a problem most of Europe doesn’t have.
How much savings does the average European have?
The European Central Bank runs a survey called the Household Finance and Consumption Survey (opens in new tab). It asks about 90,000 households across 22 EU countries what they own and what they owe. The latest round was collected in 2023 and published in June 2026.
If you want the short version, keyed to the ages people actually ask about:
| If you’re around | Typical euro-area household holds | What actually sets your number |
|---|---|---|
| 30 | €9,000, but from the wide 16-to-34 band, so read it loosely | three to six months of your spending |
| 40 | €12,900 (band 35 to 44) | that, plus whatever gap your pension leaves |
| 50 | €16,900 (band 45 to 54) | the same two, worked out again |
Before you measure yourself against that, mind what these numbers actually are.
These are medians, not averages. An average is what you get when you add a Luxembourgish private bank to a Latvian pensioner and divide by two, and it isn’t a figure either of them would recognise. The median is the household standing in the middle of the queue.
Each figure covers a whole household too, however many people that is. If you live alone, your comparison is lower: across all ages, the median one-person euro-area household holds €67,000 in net wealth and €11,600 in savings and investments.
The survey also counts everyone from 16 to 34 as one group, which leaves 30 inside a very wide band. Forty and fifty sit much closer to the middle of their bands.
Now look at the shorter bars again. They barely move. Between your late thirties and your early sixties the typical household not quite doubles its savings and investments, from €12,900 to €23,600. Over the same stretch the tall bars climb by €108,600, and that climb is housing equity.
What drives it is how many households own their home at all, 54% at 35 to 44 against 68% at 55 to 64, and the debts they clear along the way. Among those still carrying debt, the median owed falls from €67,700 to €23,000. Whatever is going on with money in Europe, very little of it is going on in the savings account. Not much of it is happening in the stock market either, and why Europeans avoid shares has its own explanation.
One thing that chart can’t show you matters more than anything in it. The survey doesn’t count what you’ve built up in a state or workplace pension. The ECB leaves out the current value of public and occupational pension plans by definition, which leaves the countries with the biggest workplace schemes looking thinnest here. So a household that looks thin on savings may be quietly rich in a pot nobody counted. Hold that thought.
Normal isn’t the same as fine, incidentally. A median tells you where the middle is and nothing about whether it is enough, and 29.2% of people in the EU couldn’t cover an unexpected expense (opens in new tab) in 2025. Plenty of the households in that chart are not comfortable. They are only typical.
Do you still need to save if you have a pension?
This is where the American rule falls over, and the usual explanation of why is wrong.
The usual explanation is that Americans get no state pension. They do. For an average earner the compulsory American system replaces about 51% of working income, according to the OECD’s Pensions at a Glance 2025 (opens in new tab). Germany manages about 53%. You could put a cigarette paper between them.
The rule exists for a different reason. In the United States the compulsory system stops at roughly half, and the other half is meant to come from you, out of a workplace plan you fund and pick yourself. Save ten times your salary by 67 and the two halves add up to something like the life you had. It isn’t a moral position about thrift. It’s arithmetic for filling one particular hole.
Europe’s hole is a different size. Across the EU, compulsory pensions replace about 68% of an average earner’s income.
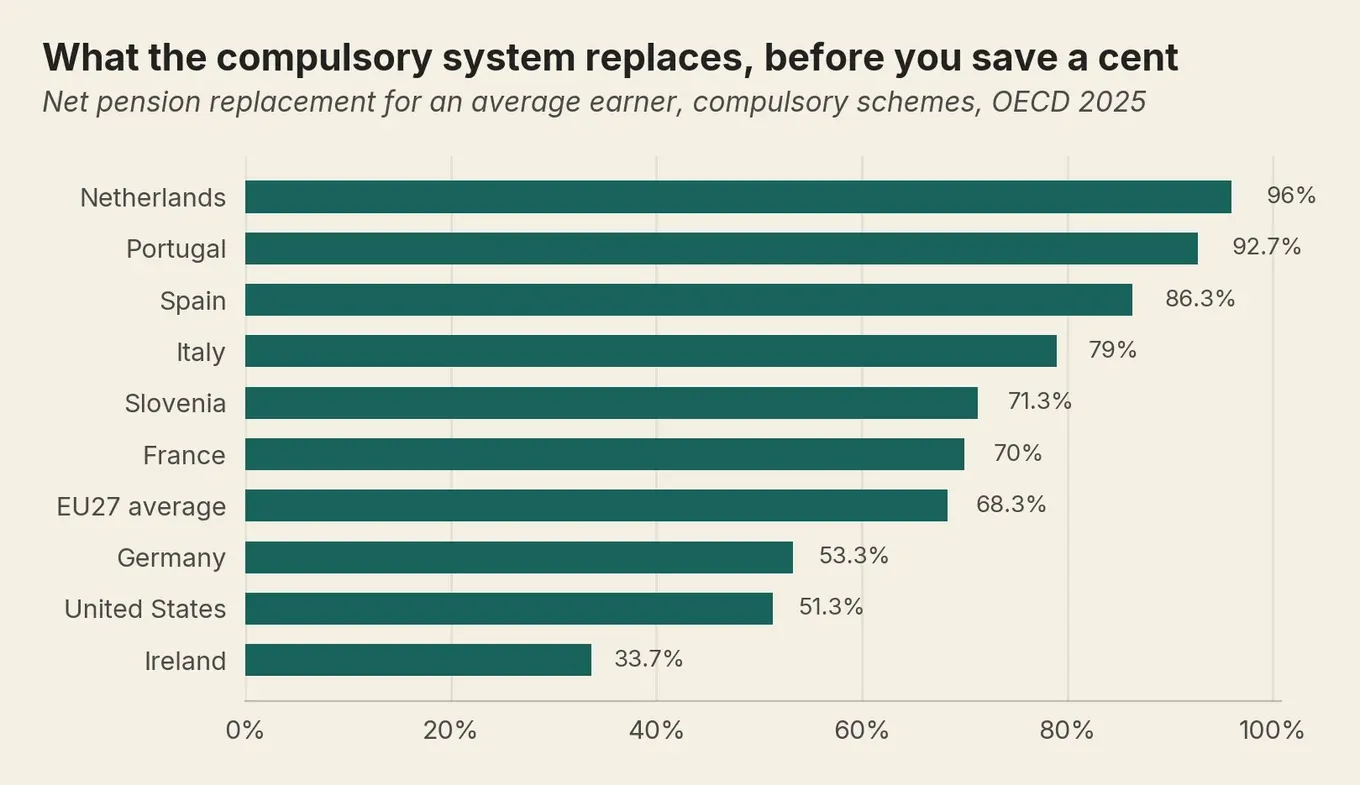
Read that chart with one word in mind, and the word is compulsory, not state. The Netherlands doesn’t reach 96% by writing enormous government cheques. It gets there because about nine in ten Dutch employees sit in a workplace scheme they never chose, set up over their heads by their industry and taken off their pay before they see it. The Dutch state pension is flat-rate; the sector funds supply the larger part. So the Dutch aren’t better savers than you. They’ve simply been enrolled in something they can’t forget to do.
That distinction runs across the whole chart. Ireland’s 34% counts the state pension and nothing else, so it looks like a disaster and isn’t quite one: add a voluntary pension paid into for an entire career and Ireland lands near 72%, Germany near 68%. The German figure assumes 4% of pay going into a private plan every year from 22, which is a large assumption to hang a retirement on. Ireland also began putting employees into workplace pensions by default (opens in new tab) in January 2026, after that figure was set.
Every number here describes an employee who starts at 22 on an average wage, never stops, and retires at whatever pension age their country has reached by the time they get there. Work for yourself, take time out, or go part-time, and the real figure comes in lower again.
Eight markets, side by side.
| Market | Median savings and investments | Compulsory pensions replace |
|---|---|---|
| Germany | €27,600 | 53% |
| Netherlands | €23,500 | 96% |
| France | €20,600 | 70% |
| Ireland | €15,900 | 34% |
| Spain | €14,600 | 86% |
| Italy | €10,600 | 79% |
| Portugal | €6,600 | 93% |
| Slovenia | €3,100 | 71% |
The rough shape is that where the pension does less, households hold more, and Germany and Portugal sit at the two ends of it. The exceptions are where it gets interesting. Ireland has the thinnest state pension on the list and only middling savings, because Irish wealth sits in bricks. The Netherlands has the fattest compulsory pension and saves anyway, except the survey can’t see the Dutch workplace pot at all, so that row understates the Dutch position.
France and Slovenia are the odd couple here. A point apart on pension, and more than six times apart on savings. You would think the Slovenians were struggling. They aren’t: count everything they own and their median net wealth is €154,500, a shade above France’s €149,000. The money just sits in different places. Less of the Slovenian figure is cash and more of it is the house, which 76% of Slovenian households own against 57% in France.
How do you find out what your pension will pay?
In most of Europe the answer is a free government website you probably already have a login for.
Germany doesn’t even make you go and look. If you’re 27 or over with five years of contributions, Deutsche Rentenversicherung posts a Renteninformation (opens in new tab) through your door every year with a projection on it, and from 55 a fuller Rentenauskunft every three years in its place. It’s the brown envelope you’ve been not opening. That letter is the state pension and nothing else, though, and the German state scheme stops at the 53% in the table above. Getting to 68% takes a private plan on top, which is precisely the part the envelope can’t show you. Digitale Rentenübersicht (opens in new tab) can. Same organisation, free, and it pulls state, workplace and private onto one screen, though the state half only appears from 27. Providers running more than 1,000 pension pots had until the end of 2024 to connect to it.
| If you’ve worked in | Look for |
|---|---|
| Germany | rentenuebersicht.de, or the yearly Renteninformation letter |
| Netherlands | mijnpensioenoverzicht.nl, via DigiD |
| France | info-retraite.fr, all schemes in one place |
| Ireland | Contribution statement on MyWelfare.ie, a record not a forecast |
| Italy | La mia pensione futura, on the INPS site |
| Spain | Simulador de jubilación, in Tu Seguridad Social |
| Portugal | Simulador de pensões, in Segurança Social Direta |
| Slovenia | Pokojninski kalkulator, in Moj eZPIZ |
If you’ve worked in several countries, findyourpension.eu (opens in new tab) is the EU’s attempt to stitch them together. Sweden, Belgium, the Netherlands and France are all in the consortium behind it, and so far it can pull your actual figures from Belgium and France, with more promised. One to bookmark for later. In the meantime, take no single row of that chart as yours: each country you have worked in (opens in new tab) works out and pays its own slice, based on the years you spent there.
Whatever it gives you, write down one figure: the share of your current pay you’re on track to get. Everything hangs off that share. It decides how much you have to fund yourself, and it’s the only number here that’s actually about you. Ireland makes you work a bit harder. MyWelfare hands you only a contribution count, so you do the sums yourself, against the state pension rate bands.
How do you know if you’re saving enough?
A European version of the rule would be the same mistake in a different currency. Two numbers settle it instead, and you can have both by Friday.
The first is what you spend in a month. Not what you earn, what you spend. Most people are out by a wide margin, so it pays to run a proper audit of your monthly spending once and stop guessing. Three to six times that figure is your cash buffer, the money that stops a broken boiler becoming a loan. Measure it in months of spending, not multiples of salary, because the boiler costs the same whether you earn €30,000 or €90,000.
The second is the gap. Take the replacement percentage you looked up. Keep it on the same footing as the income you set it against: the figures here are after tax, and most national trackers project before it. Subtract it from the share of your income you’d want to live on later. If your pension is projected to cover 70% and you’d want 85%, then 15% of your income is the part you’re funding, and that’s your actual target. On a €36,000 salary, say, that gap is €5,400 a year, or €450 a month of retirement income you would be covering yourself. Turning an annual figure like that into a pot size is what the 4% rule is for. If it covers 90%, you’re arguing over the last tenth and can go and do something else.
Two things close a gap faster than saving harder does, and both are admin. If your country runs workplace pensions, check you’re actually in yours, and didn’t opt out years ago and forget. Then check whether your employer would match more than you’re putting in. Employer contributions are the closest thing to free money most people are ever offered, and claiming them takes an afternoon. If you work for yourself there is no employer to match you, which makes the tracker figure worth looking up sooner.
One more variable, and it moves the wealth figures harder than age does. Among euro-area households, those who own their home outright hold a median net wealth of €292,900. Households still paying a mortgage hold €232,800. Renters hold €14,100.
It’s also the figure most often read the wrong way round. Owners are older and richer to begin with, so the number says nothing about what buying would do for you. What it says is that in Europe, wealth and housing have become close to the same thing. Ireland is the clearest case: the highest median net wealth in this comparison at €258,100, and less in savings and investments than Germany, because Irish wealth is the house.
If you rent, those figures read harshly, and they shouldn’t. They measure a kind of wealth you haven’t bought into, in a market you may not be able to buy into. Your savings carry more weight because they’re doing more of the work, and your benchmark is the buffer and the pension, not the property.
The order itself is dull. A month of spending in cash first, so a bad week does not put you back on the card. Then clear anything expensive, because no savings account pays what a card or an overdraft charges. Then build the buffer out. Then the gap. The emergency fund calculator will size the buffer, and there’s a monthly method for tracking net worth if you’d rather see the whole picture than one slice of it.
So, no, you probably don’t need six times your salary by 50. Possibly rather less, if you live somewhere the compulsory system has already done the heavy lifting. Possibly more, if you’re renting somewhere it hasn’t.
The rule was never wrong exactly. It was foreign. Your own number is sitting on a government website, and in Germany it comes through the door once a year unasked. Go and look.
Frequently asked questions
How much savings does the average European have?
How do I find out what my pension will actually pay me?
Do I need to save for retirement if I have a pension?
How do I know if I am saving enough?
Why is home ownership so much lower in Germany than in Ireland?
Is the median the same as a target?
Sources (10)
- European Central Bank: Household Finance and Consumption Survey, Wave 2023, statistical tables published June 2026
- OECD: Pensions at a Glance 2025, Tables 4.4 and 4.5, net pension replacement rates
- Deutsche Bundesbank: Reasons for the low homeownership rate in Germany, research brief
- European Tracking Service on Pensions: findyourpension.eu
- Deutsche Rentenversicherung: Renteninformation, annual pension statement
- Digitale Rentenübersicht: state, workplace and private pension entitlements in one place
- Your Europe: state pensions when you have worked in more than one EU country
- Eurostat: inability to face unexpected financial expenses, indicator ilc_mdes04, 2025
- Government of Ireland: My Future Fund automatic enrolment, launched January 2026
- Fidelity: retirement savings guidelines, salary multiples by age
— That's the lot. It is now night.
Want more of this in your Google results?
Add Money Owl as a preferred source, and Google will show our finance pieces higher when you search for them.
By Jure Jaklič
Founder and editor of Money Owl. Data analyst by trade; personal finance learned first-hand across six European countries.
Recommended

Why don't Europeans invest in stocks? Where the money went instead
Caution gets the blame. Add up all euro-area household assets and about €66 in every €100 is property. That is the area's total, not one household's.

How to track your net worth: a monthly guide for Europeans
Track net worth across countries and currencies with one home currency, one rate source, and one date each month. A plain, repeatable habit.

Employer pension contributions mean five different things across Europe
Cross a border and employer pension contributions become five different things. Ireland and Britain force a minimum in; Spain requires nothing at all.